Irrecoverable carbon, biodiversity, and hotspots of emerging infectious disease web application. This application allows users to explore the intersection of key natural assets and areas of emerging infectious disease. Irrecoverable carbon refers to carbon which, if lost, could not be restored in the timeframe needed to avoid the worst impacts of climate change (Noon et al., 2021). Biodiversity data are modified from IUCN Red List and BirdLife International expert species range data to represent range-size rarity based on area of habitat for terrestrial vertebrates. Emerging infectious disease hotspot data come from Allen et al. 2017.
Percentages of white and minority UCSB Undergraduate Students (2008-2018). Data is compiled from the annual UCSB Campus Profiles prepared by the Office of Budget and Planning through the Institutional Research, Planning, & Assessment Initiative (UCSB). The category titled ‘Asian’ includes Asian and Pacific Islander students. The majority of the students within the category titled ‘Other’ are American Indian / Alaskan students and E. Indian / Pakistani students. The format of this graph was inspired by work from the Pew Research Center.
Species and climate change explorer web application. This application analyzes and communicates modeled changes in species' ranges due to climate change in any user-defined area of interest.


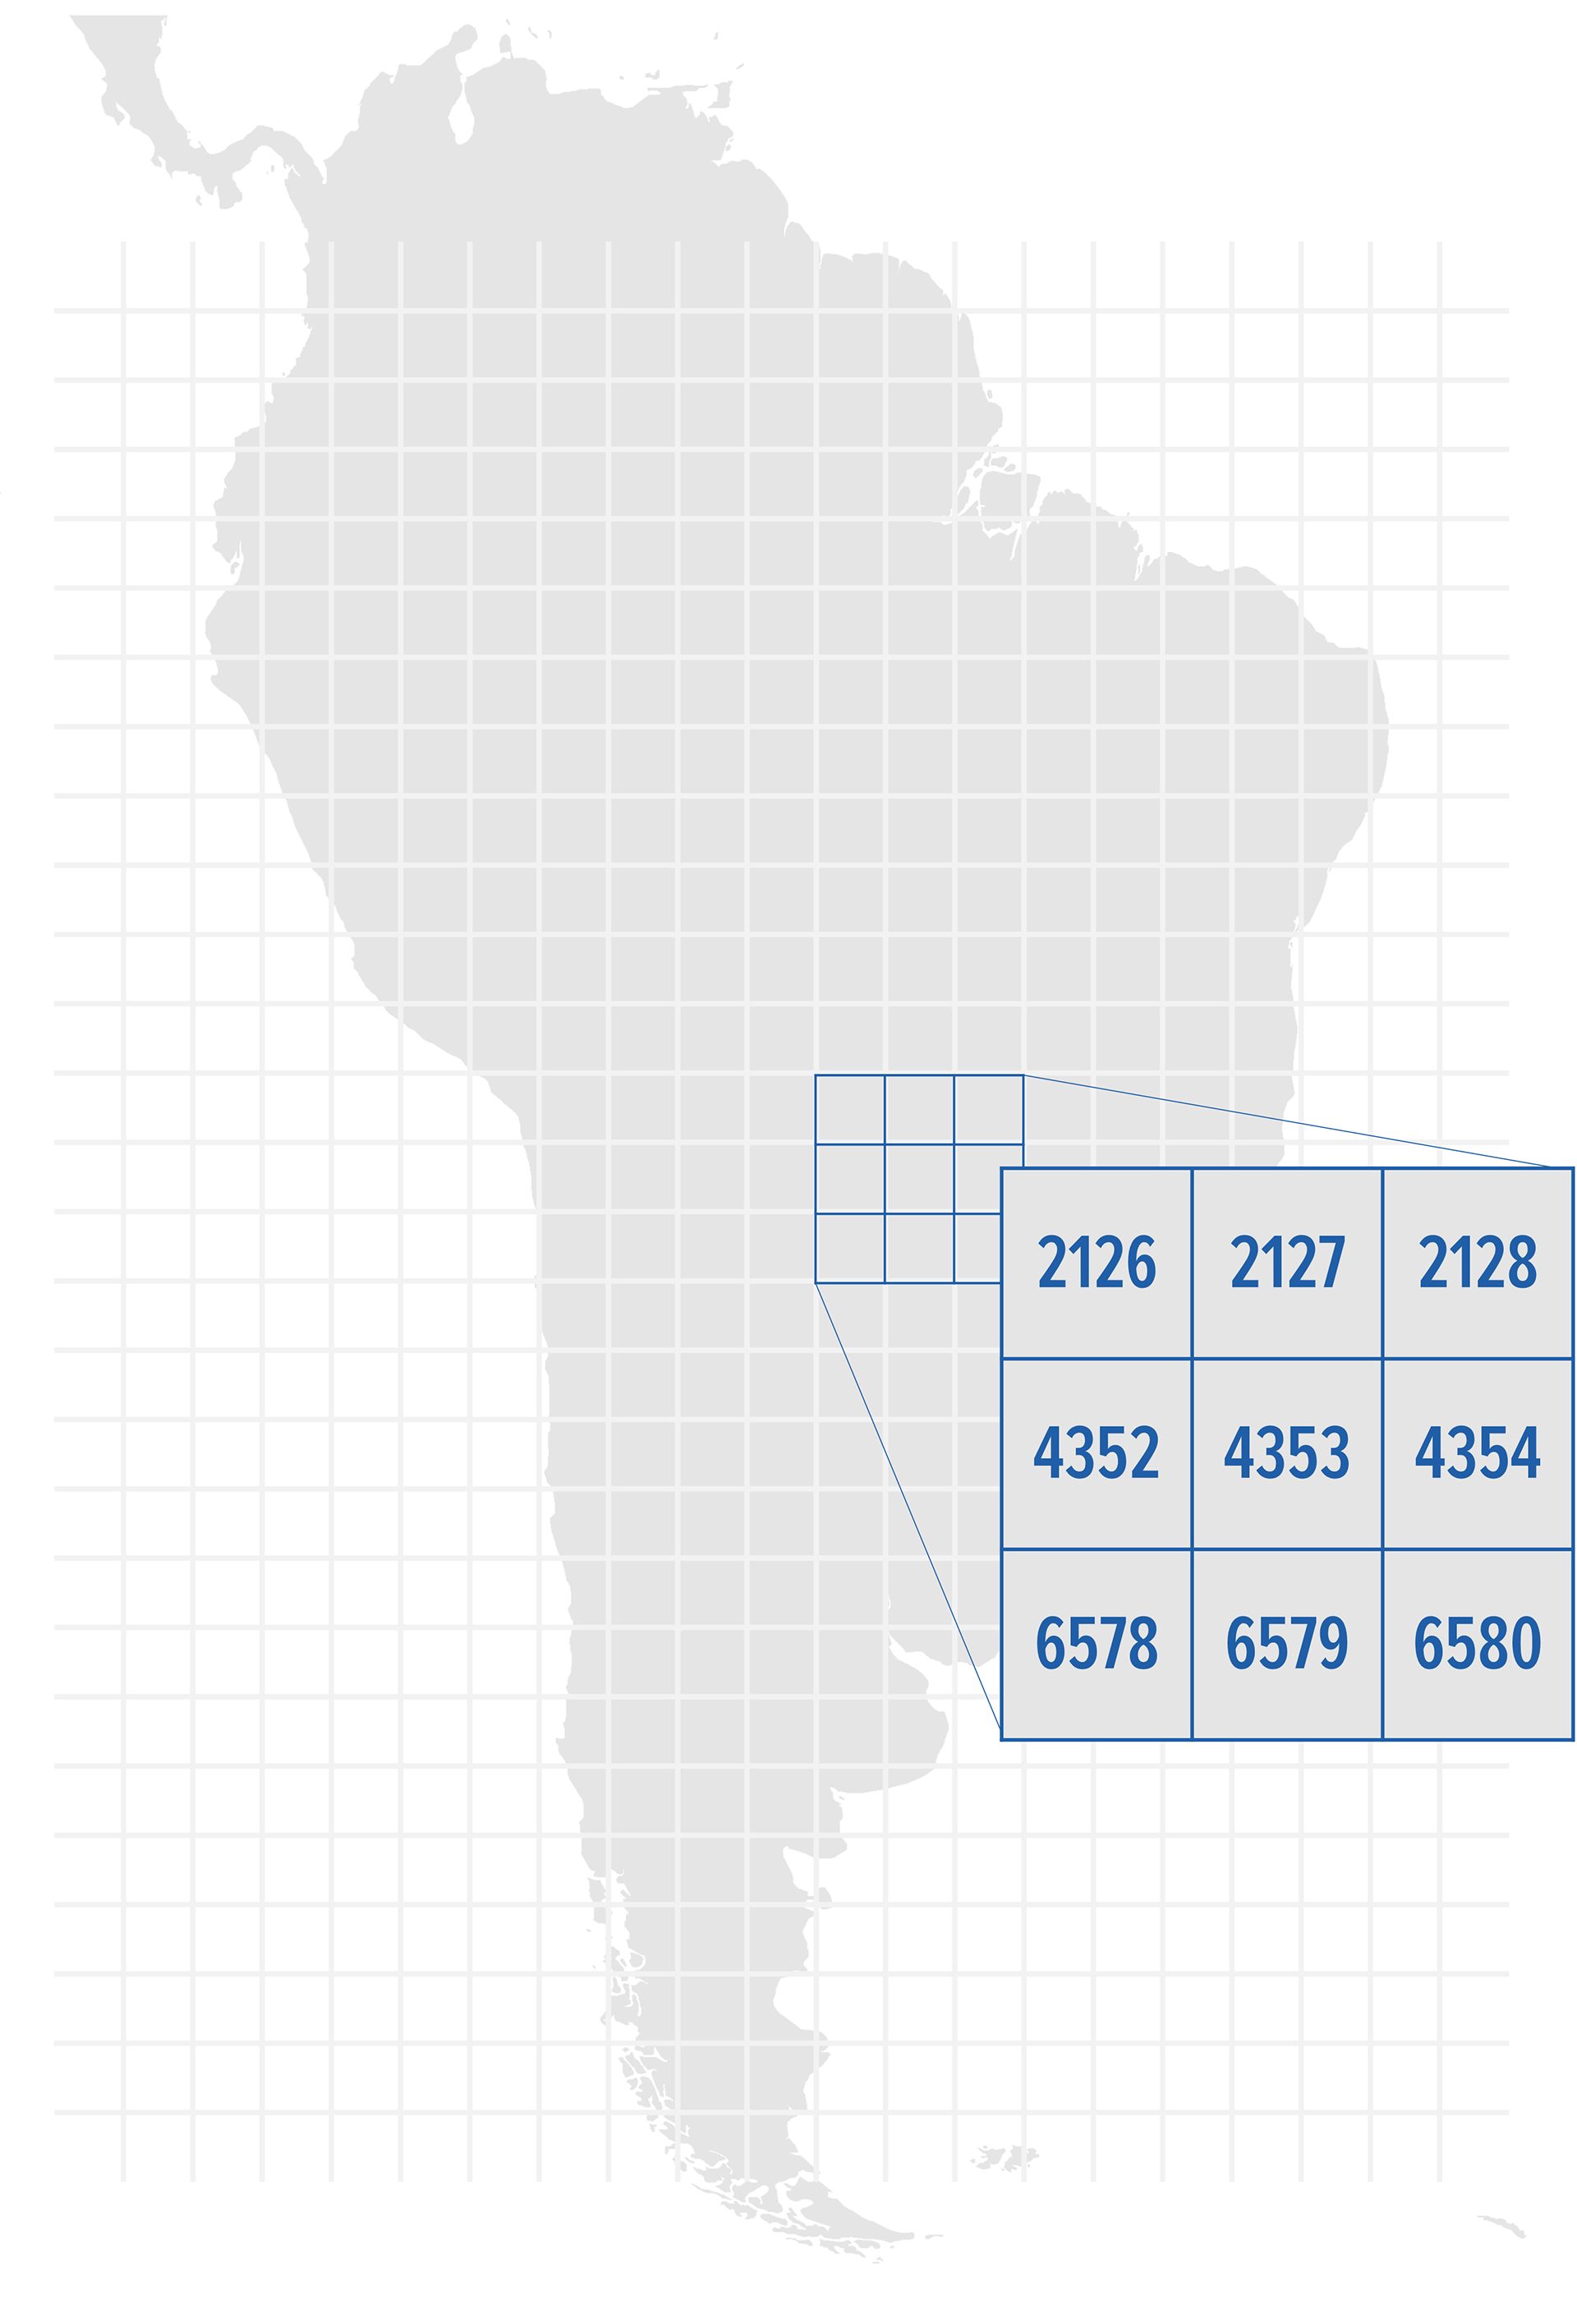
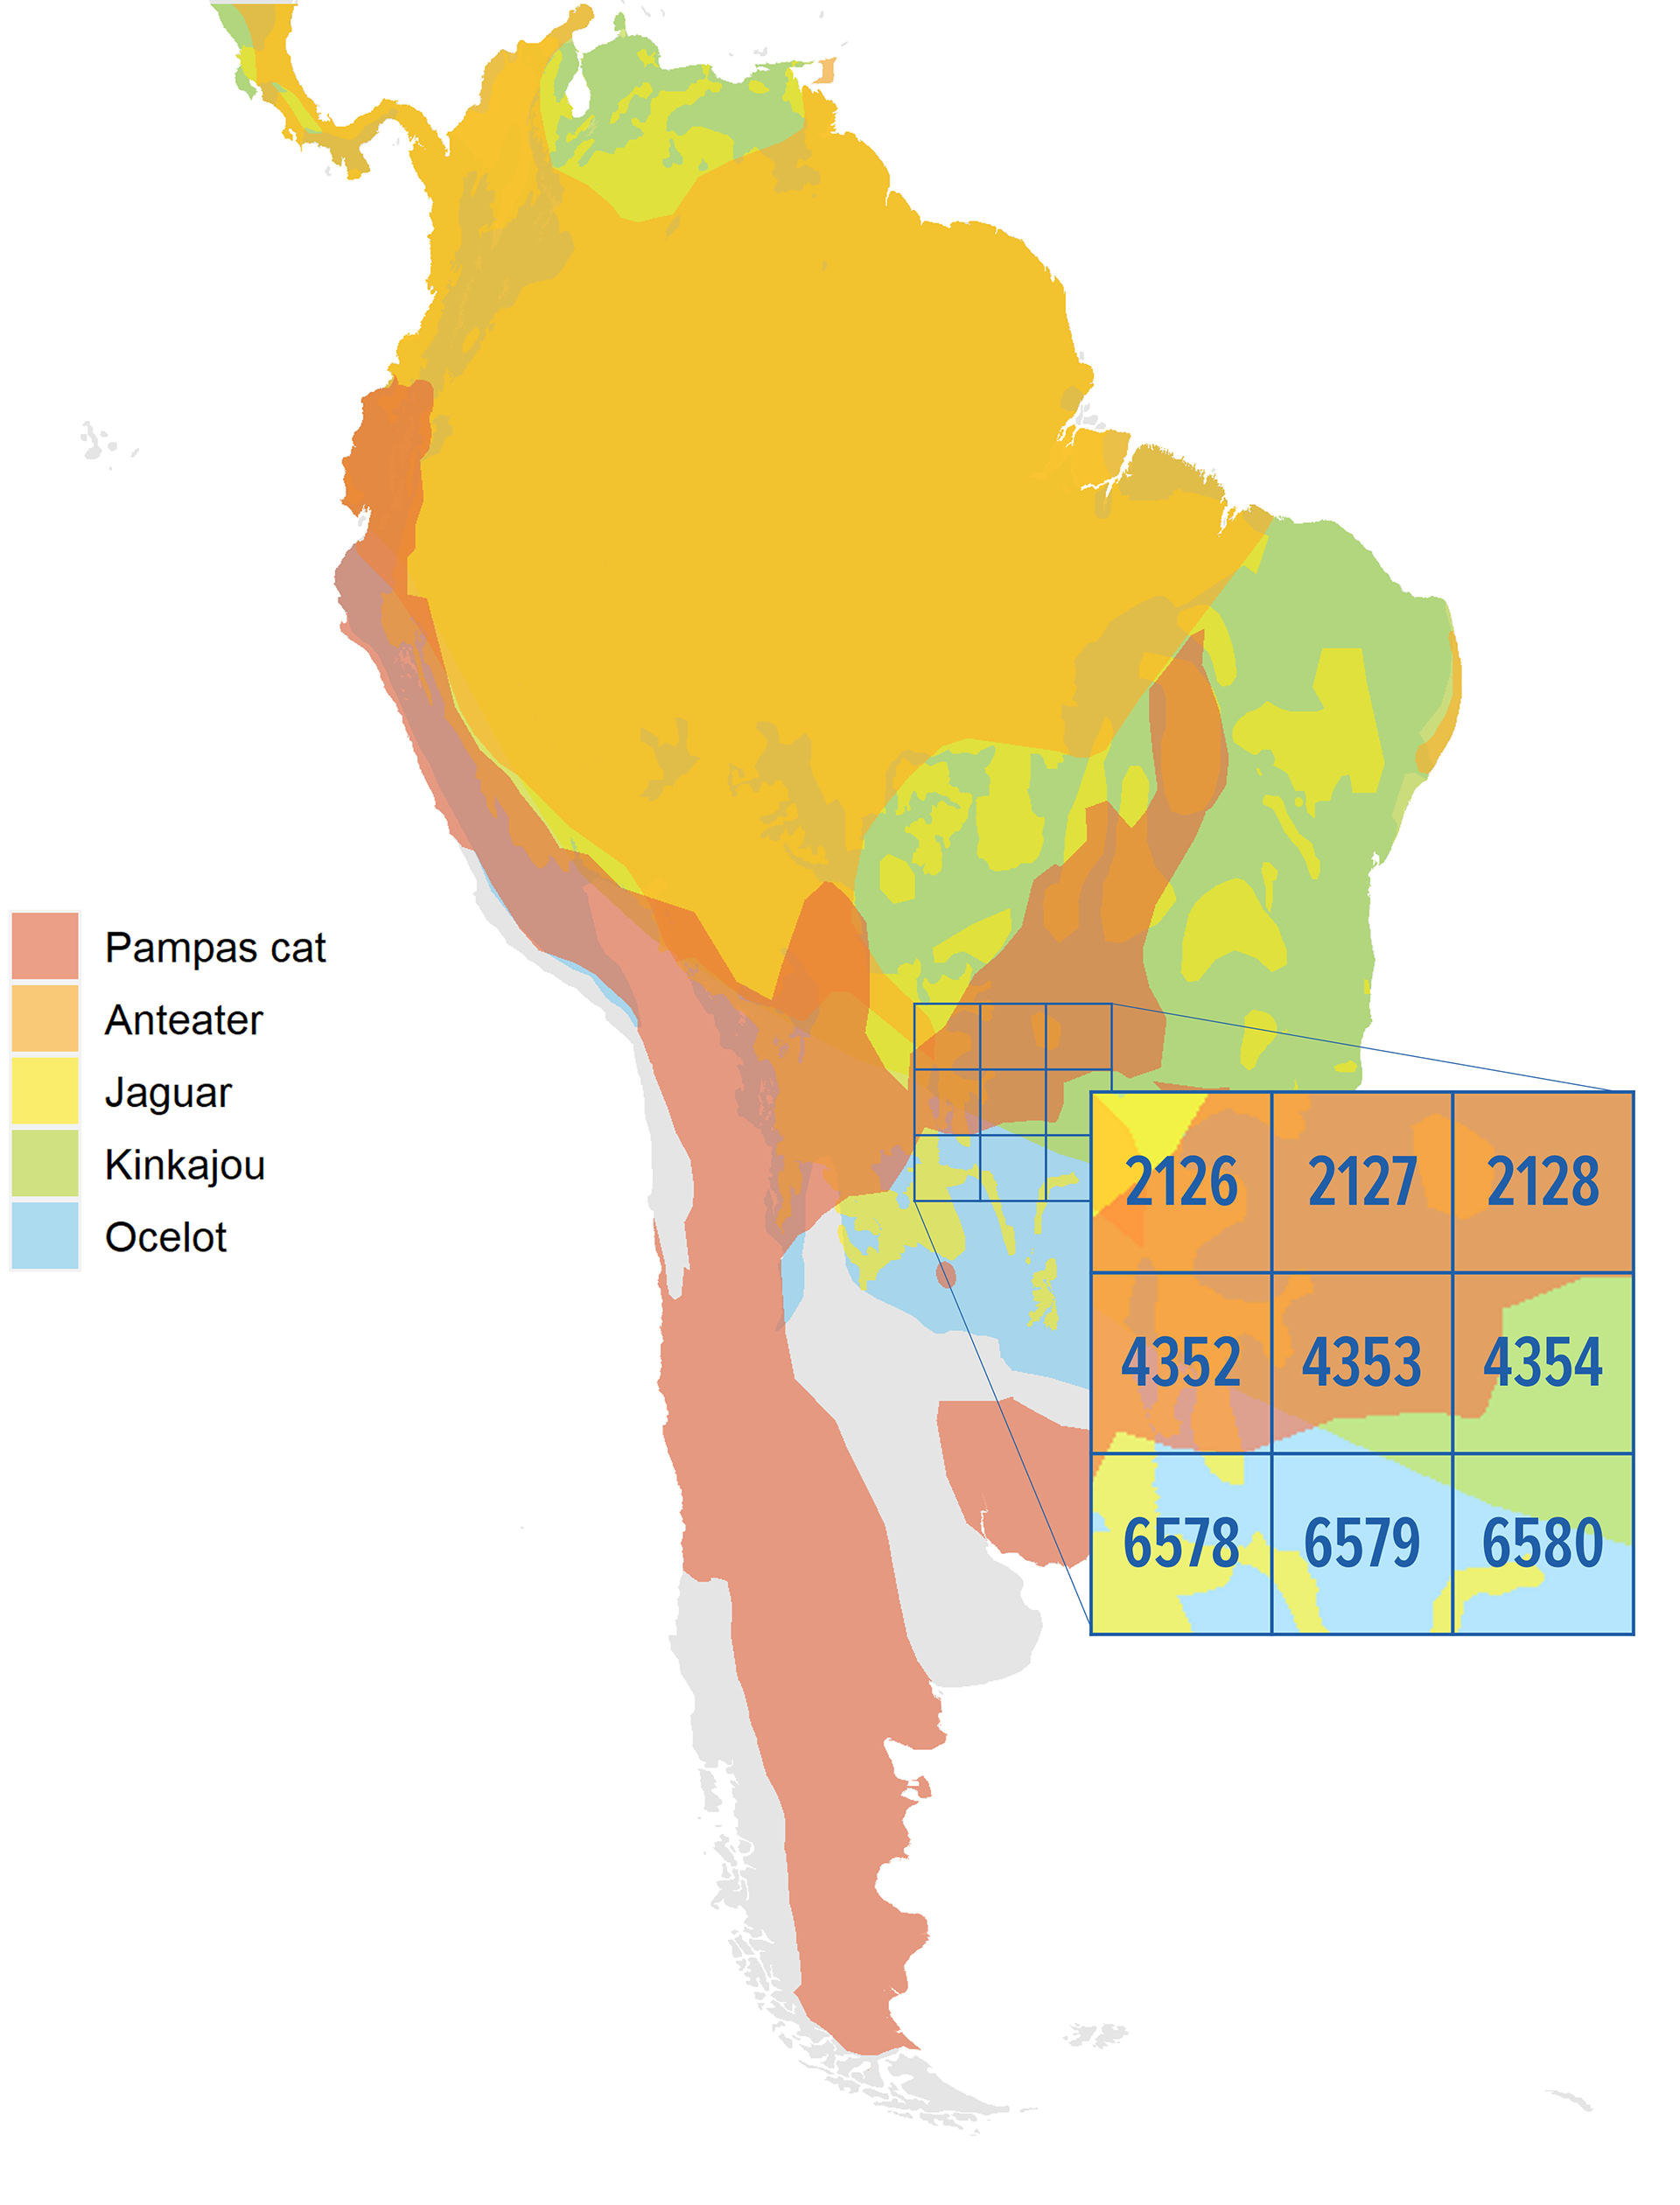
Illustration of grid cells and species ranges for five species in South America to demonstrate a methodological approach to analyzing species-level data using indexed grid cells.
Select digital illustrations of western bird species. From the top left, species include: belted kingfisher, Anna's hummingbird, Townsend's warbler, pacific wren, and varied thrush.
Projected change in average monthly total precipitation (1970-2000 to 2041-2060) in Brazil for two shared socio-economic pathways (SSPs). Projected change in average precipitation in Brazil under SSP 126 (A) and SSP 585 (B). Precipitation projection was processed by the global climate model (GCM) BCC-CSM2-MR. Data are from WorldClim (Version 2.1).
Monthly weight distributions of adult and juvenile snowshoe hares (Lepus americanus) from 1999-2012. Winter data is not included because only one data point was available (February 2007, 1620g male), possibly because the line between adult and juvenile is more clear from spring-fall. Data is from Bonanza Creek LTER’s snowshoe hare physical data in Bonanza Creek Experimental Forest Dataset (1999-2012).
Monthly counts of adult steelhead salmon (Onchorhynchus mykiss) passing the Bonneville Dam (1940-2019) grouped by year. Data is from Columbia River DART’s Adult Passage Graphics & Text dataset.